5 Storytelling Rules for Pharma and Healthcare, Part 2
The last few months, indeed almost two years, have shown us how important proper communication is in the healthcare sector. After all, the pharmaceutical industry has to deal with criticism and a lack of understanding time and time again. dealing with the curse of knowledge in the first part of our storytelling series for pharma and healthcare, the second part is about storytelling principles and the right context.

Second Rule for Pharma Storytelling: Use Storytelling Principles
This brings us to the second rule for pharma storytelling. The biggest shortcoming of many analysts, researchers or even lovers of tables and Excel lists is that they want to underpin their expertise with results that are as complex and compact as possible. However, the question of how data analyses and visualizations are embedded in a story is not about completely questioning established formats such as bar charts, pie charts or line charts. The aim is for the content to be understood and emotionally internalized by the audience. However, complicated facts and figures usually have the opposite effect.
Data-Storytelling

Evaluations offer a great opportunity to take the audience on a journey, away from the familiar world of known information, towards mysteries and insights that open their eyes to new perspectives. For example, researchers can let their audience explore data worlds themselves with interactive graphics like a detective and involve them much more deeply in what is happening. Metaphors and analogies can be used to link new insights with familiar experiences, making it much easier to classify them.
Stories focus our attention, arouse our interest and motivate us to take certain actions.
We need the figurative hook to get the audience’s attention first. In the so-called hold phase, we have to hold and intensify the audience’s attention. At the end, we want to reward the audience’s attention in the payoff.
In other words, I need to provide my target group with an insight that motivates, inspires and, in the best case, encourages them to take action.
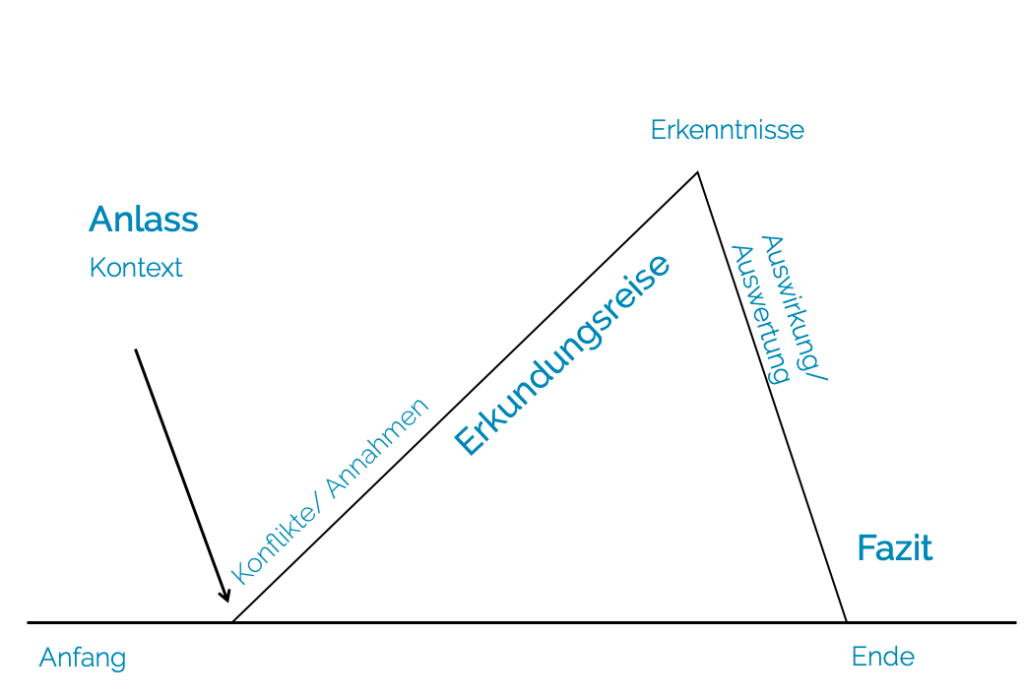
And it is precisely these principles of hook, hold and payoff that also apply to data storytelling. Like a good story, data analysis should have a starting point. have a middle and end section.
The beginning puts the data into context: What is the reason for looking at these figures? The middle section is about the exploratory journey: Where do conflicts arise? Are there any facts that call the previous assumptions into question? What insights could have a direct impact on the lives of the audience? The final step is the conclusion: What impact does the content presented have? What is the message? What opinion or moral can you take away from the story?
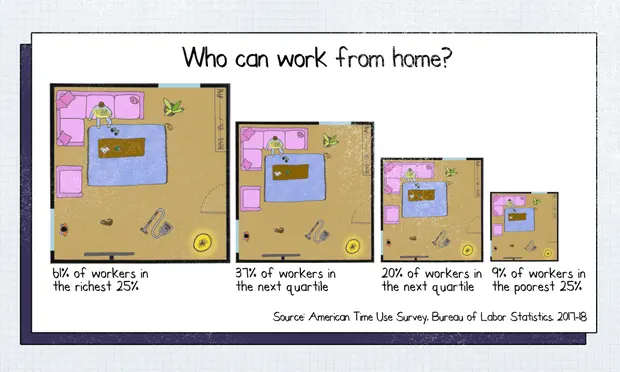
The Guardian, for example, has shown very good examples of how medical facts and connections with Covid-19 and our lives can be presented in a simple and understandable way. No further words are needed to explain, for example, the connection between the opportunity to work from home and income.

Third Rule for Pharma Storytelling: The Need for Context
Stories have always been one of the most efficient ways of sharing and passing on human experiences. Narratives based on data and analysis are only a relatively recent development. Narration helps us to simplify the complex world. Stories provide context, insights and interpretations – all the things that also give meaning to data and make studies more interesting and relevant. However, before you can decide on a specific plot, there are often many different paths to take in advance. The important thing is to find the one pearl in the mass of investigations that can be used for the story.
If you want to know how dry numbers can be put into the context of history and presented in an entertaining way, you should watch the videos by “data god” Hans Rosling. The TED Talks of the – now deceased – Swedish health expert with a penchant for data stories prove this: Even supposedly boring evaluations can be presented in such a way that even laypeople understand them and enjoy watching them.
We now know that, in addition to stories, the use of storytelling principles and embedding them in the right context are crucial ingredients for presenting topics from the healthcare sector in a vivid way. In the third and final part of our storytelling series, you can find out why it is also essential to know your audience and their level of knowledge and which story types are suitable for pharmaceutical and healthcare storytelling.
Share this article


